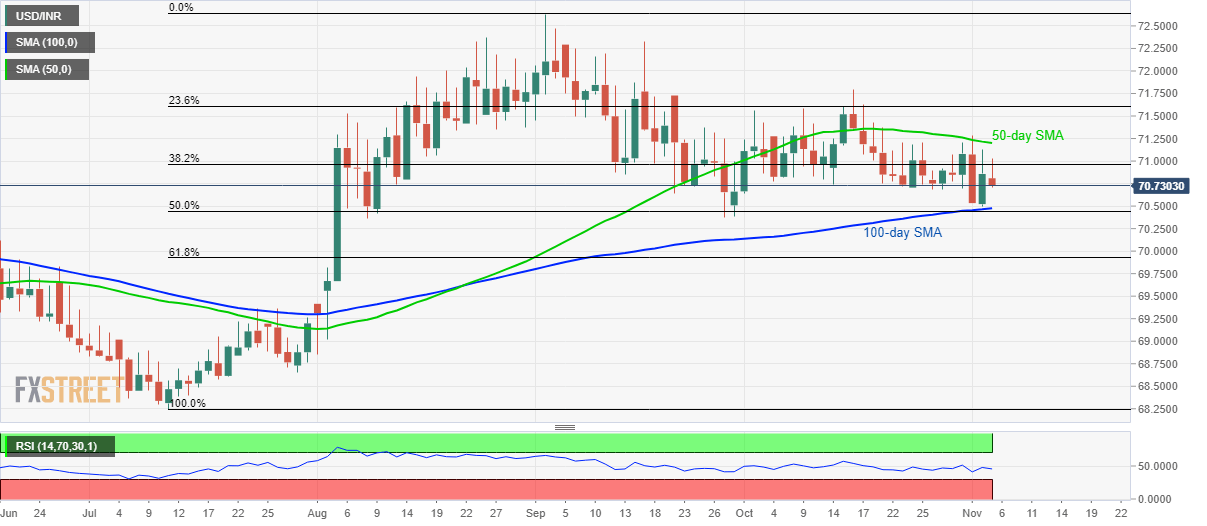
USD/INR technical analysis: Struggles between 50, 100-day SMA
- USD/INR witnesses pullback from 38.2% Fibonacci retracement.
- 50% Fibonacci retracement, 70.36/35 add to support.
Following its trading range between the key moving averages, USD/INR declines to 70.72 while heading into the European session on Tuesday.
The quote recently took a U-turn from 38.2% Fibonacci retracement of July-September upside, at 70.96, indicating another visit to 100-day Simple Moving Average (SMA) level of 70.47. Also increasing the strength of the support is 50% Fibonacci retracement.
It should, however, be noted that pair’s declines below 70.47 will aim for 70.36/35 support-zone including lows marked since early August.
During pair’s extended weakness below 70.35, 61.8% Fibonacci retracement level of 69.92 and late-July highs close to 69.36 will become sellers’ favourites.
Meanwhile, pair’s sustained rise past-50-day SMA level of 71.20, can target October high surrounding 71.80 whereas 72.30 and 72.65 could please bulls afterward.
USD/INR daily chart

Trend: sideways
