Back
2 Dec 2019
EUR/USD Technical Analysis: Euro starting December with high volatility breakout
- EUR/USD is having a substantial bullish breakout this Monday.
- The level to beat for bulls is the 1.1110 resistance.
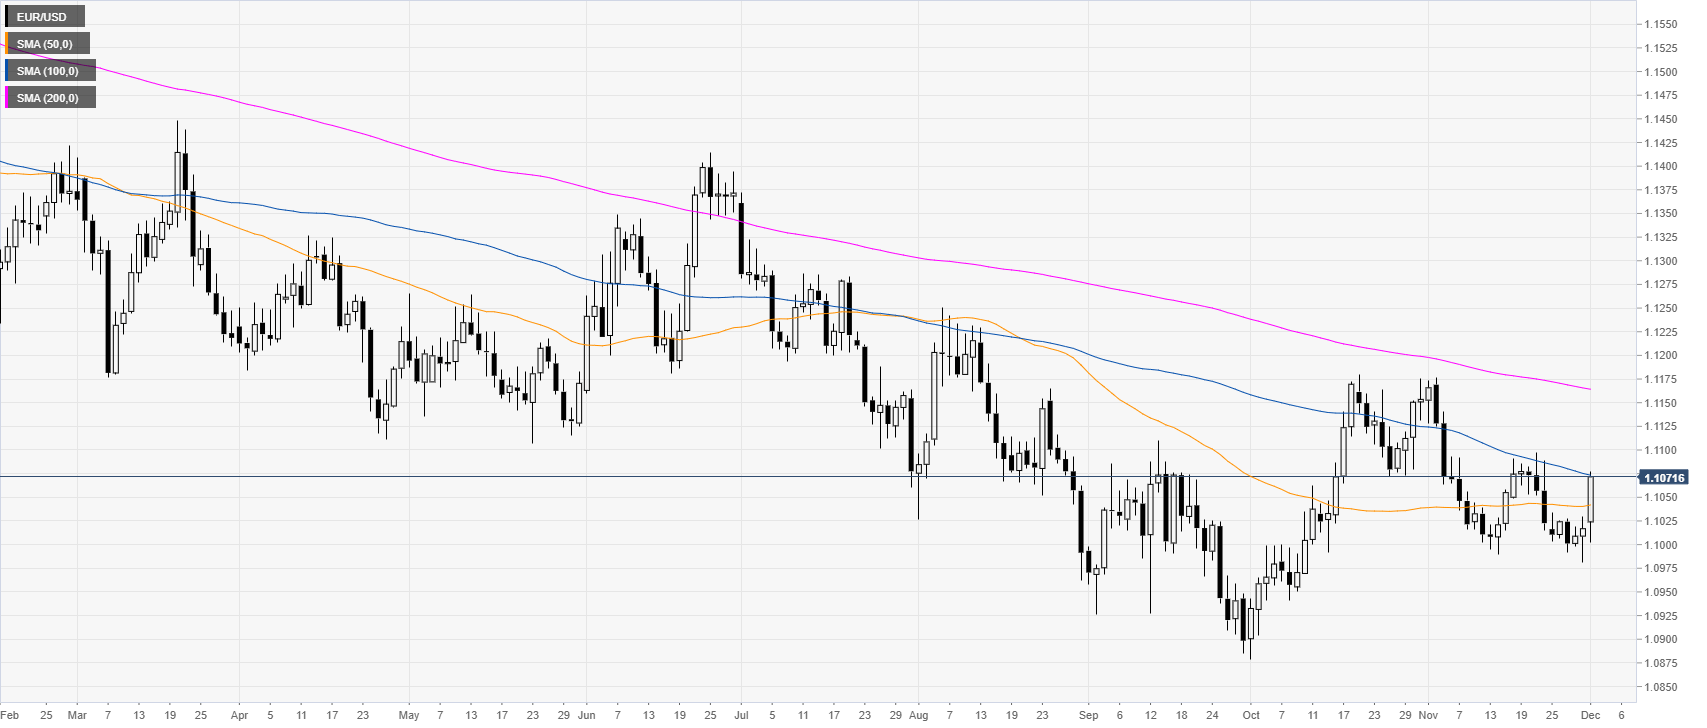
EUR/USD daily chart
The euro/dollar currency pair, on the daily time frame, is trading in a downtrend below the 100 and 200-day simple moving averages (DMAs). However, this Monday, the market is having a sharp reversal up above the 1.1000 handle and the 50 SMA.
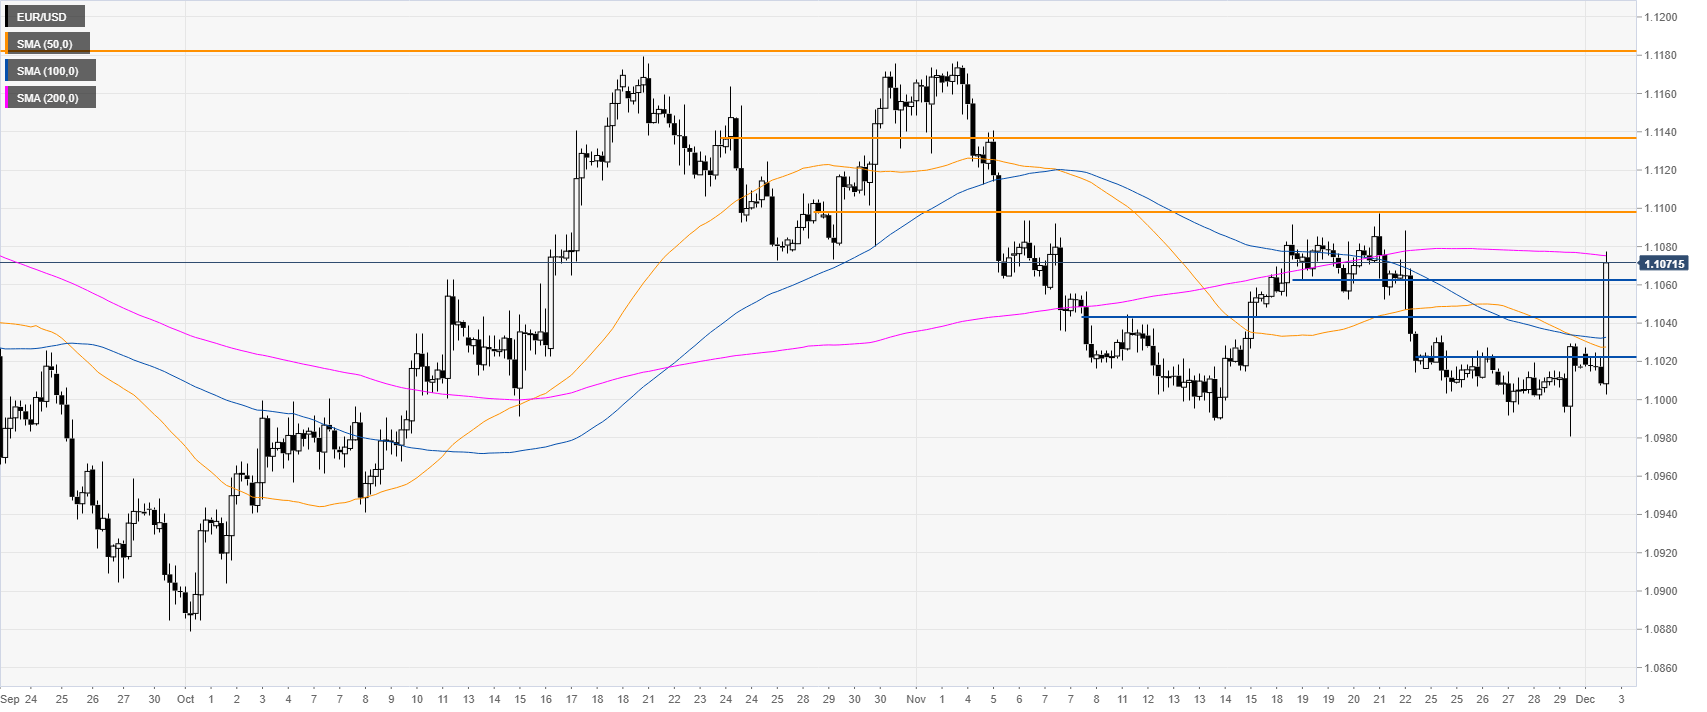
EUR/USD four-hour chart
EUR/USD is nearing the 1.1080 level while challenging the 200 SMA on the 4-hour chart. Bulls have taken control and the next objective for them is likely to reach the 1.1110 resistance level on the way up. If this level is cleared, more gains could be on the ecards as 1.1137 and 1.1180 could come into play according to the Technical Confluences Indicator.
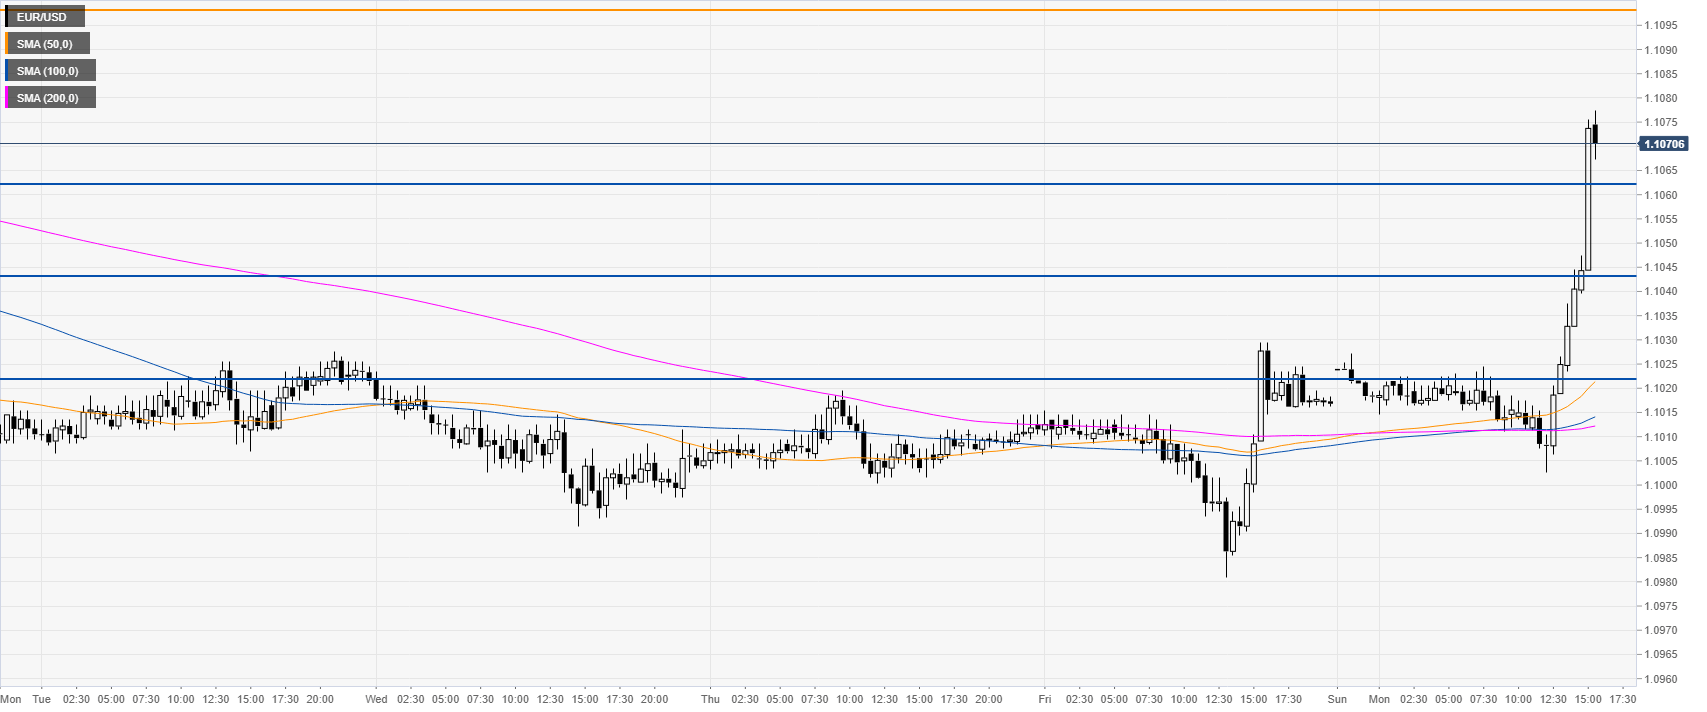
EUR/USD 30-minute chart
The market had a remarkable bullish breakout this Monday, switching the bias to bullish. Support can be seen at the 1.1062, 1.1045 and 1.1022 price levels.
Additional key levels