USD/JPY Technical Analysis: 200-DMA, 23.6% Fibonacci cap recovery gains
- USD/JPY trades modestly changed after bouncing off near-term key support confluence.
- 23.6% of Fibonacci retracement can validate the pair’s upside break of 200-DMA.
- Bearish MACD highlights November bottom on the break below 108.50.
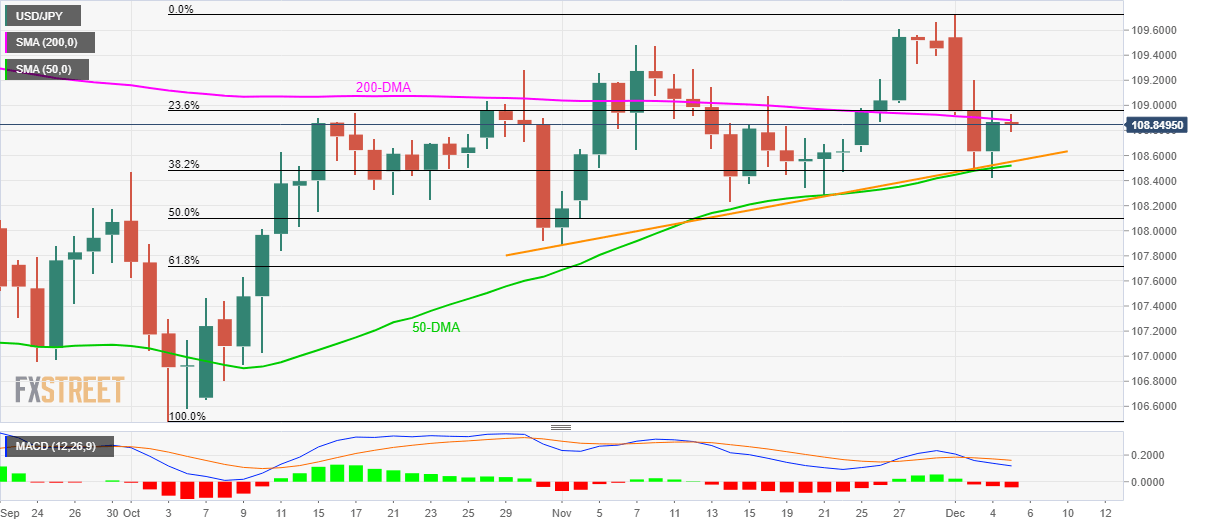
Having reversed from 50-Day Simple Moving Average (DMA) and monthly support line, USD/JPY stays mostly unchanged to 108.85 during early Thursday.
The pair stays slightly below 200-DMA level of 108.90 and 23.6% Fibonacci retracement of October-December rise, at 108.96. With this, buyers should look for entry only if prices close beyond 109.00.
In doing so, Early November highs near 109.50 and the recent top surrounding 109.75 could become their favorites.
Meanwhile, 108.50 acts as the near-term important support confluence, a break of which could direct the quote lower to 50% Fibonacci retracement level of 108.10 and November month bottom around 107.85.
On a further downside under 107.85, bears can take aim at 107.30 and October low near 106.50.
USD/JPY daily chart
Trend: Sideways