USD/CAD Price Analysis: Inside short-term falling channel below 200-HMA`
- USD/CAD stays inside bearish technical formation below the key short-term moving average.
- 61.8% Fibonacci retracement offers immediate upside barrier, the channel’s support could keep bears in check.
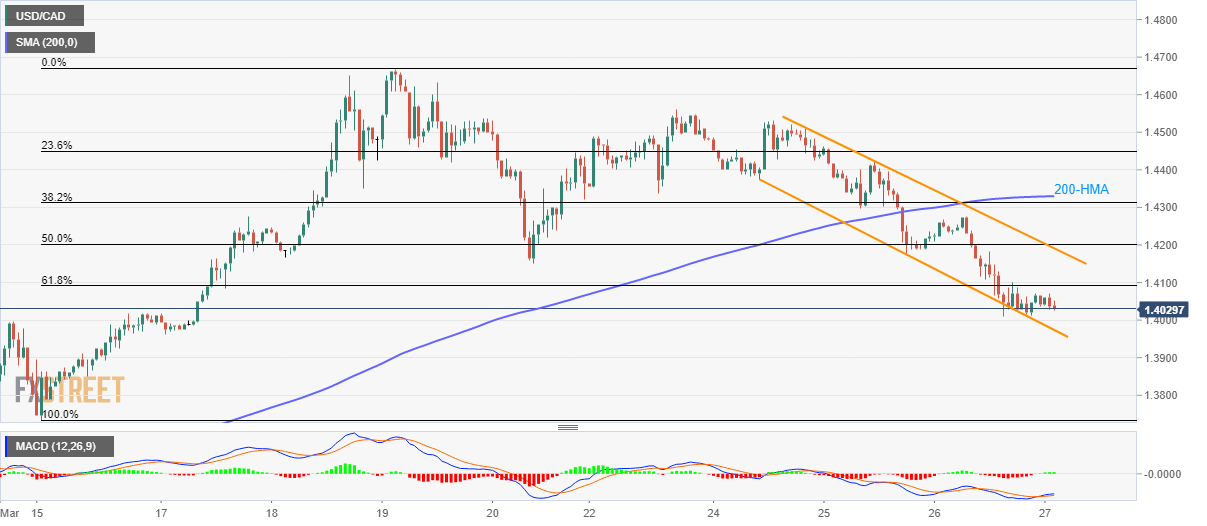
USD/CAD remains on the back foot while staying inside a three-day-old falling channel below 200-HMA, currently up 0.07% around 1.4030, during the early Friday.
Also signaling the pair’s further downside is the sustained trading below 61.8% Fibonacci retracement of its March 15-19 upside.
That said, the pair now declines towards the formation’s support line, at 1.3970, with 1.4000 round-figure acting as an immediate rest.
During the pair’s sustained break below 1.3970, which is less likely considering bullish MACD, the mid-month bottom surrounding 1.3730 could return to the charts.
On the upside, 61.8% Fibonacci retracement level of 1.4090 can offer the immediate resistance ahead of the descending channel’s resistance, around 1.4190/95.
It should, however, be noted that the pair’s ability to cross 1.4200 enables it to question a 200-HMA level of 1.4330.
USD/CAD hourly chart
Trend: Bearish