USD/CAD Price Analysis: Bears aim for yearly support line under 1.3500
- USD/CAD defies pullback from six-week low of 1.3425 while taking a U-turn from 1.3465.
- A clear downside break below 200-day SMA favors the sellers.
- A descending trend line from June 26 offers additional upside barrier.
USD/CAD remains on the back foot around 1.3450 during the pre-Tokyo open trading on Wednesday. The loonie pair slumped to the lowest since June 11 on Tuesday, before bouncing off 1.3425. Though, sustained trading below the key 200-day SMA and 61.8% Fibonacci retracement level of December 2019 to March 2020 upside keeps the bears hopeful.
As a result, an upward sloping trend line from December 31, 2019, at 1.3405 now, gains the market attention, a break of which could recall the June month’s low near 1.3315 on the charts.
During the pair’s further downside past-1.3315, February 21 low near 1.3200 holds the key to the extended southward trajectory towards 1.3000 threshold.
On the upside, a daily break beyond a 200-day SMA level of 1.3515 will not be enough to please the bulls as 61.8% Fibonacci retracement and the monthly resistance line, respectively around 1.3605 and 1.3615, stand tall to challenge buyers.
If at all the pair manages to cross 1.3615, the monthly high of 1.3715 and 50% of Fibonacci retracement close to 1.3810 will be important resistances to follow.
USD/CAD daily chart
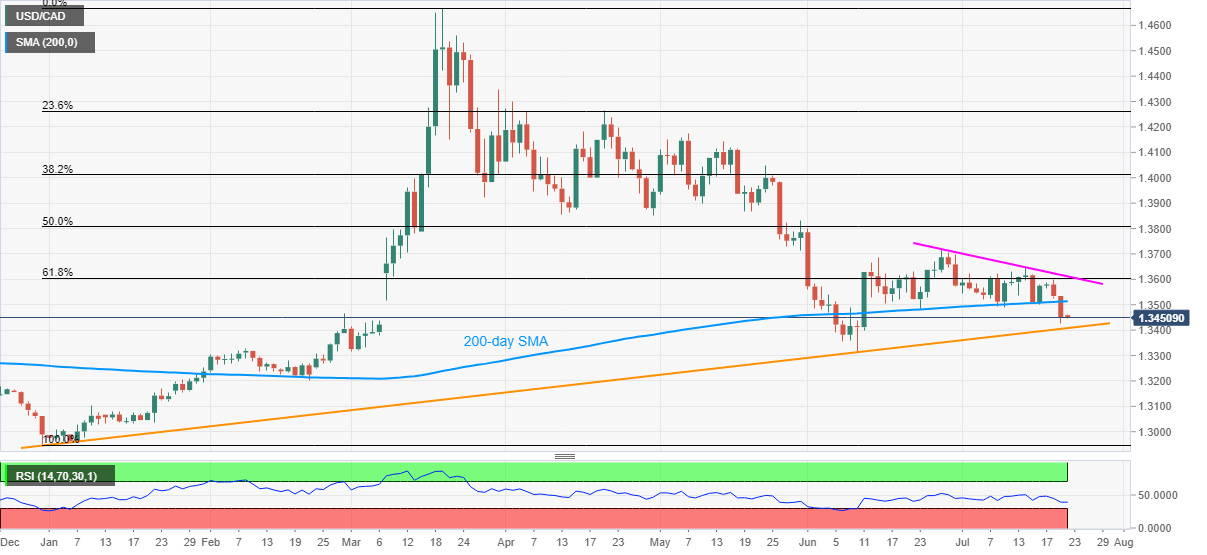
Trend: Bearish