NZD/USD Price Analysis: Bears can catch a breather around three-week-old support line above 0.6500
- NZD/USD stays on the backfoot while probing the weekly bottom around 0.6525.
- Oversold RSI conditions, lingering MACD can probe the sellers near the short-term key support trend line.
- One-week-old resistance line, 200-bar SMA restricts the immediate upside.
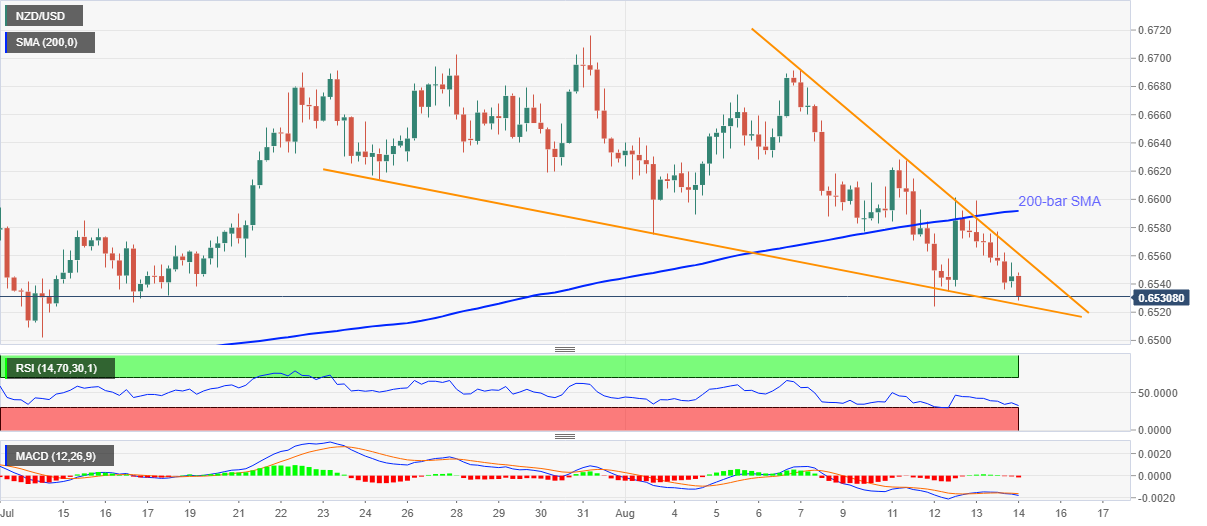
NZD/USD drops to the intraday low of 0.6528, down 0.28% on a day, amid early Friday’s trading. The kiwi pair stays on the back foot ever since it reversed from 200-bar SMA on Wednesday. However, a downward sloping trend line from July 24 can restrict the quote’s further downside amid oversold RSI conditions and lingering MACD signals.
As a result, 0.6525/25 area encompassing the weekly low and the aforementioned trend becomes the key for sellers to watch ahead of targeting 0.6500 round figures.
In a case where the bears refrain from respecting the 0.6500 threshold, July month’s low near 0.6440 will be on their radars.
On the contrary, a descending trend line from August 08 and 200-bar SMA, respectively around 0.6560 and 0.6590 could stop buyers targeting to revisit 0.6600 round figures.
NZD/USD four-hour chart
Trend: Pullback expected