Silver Price Analysis: XAG/USD struggles above $23.00, sellers await 200-SMA break
- Silver retreats from monthly resistance, snaps four-day uptrend.
- RSI conditions hints at buyer’s exhaustion, three-week-old horizontal line adds to the upside filters.
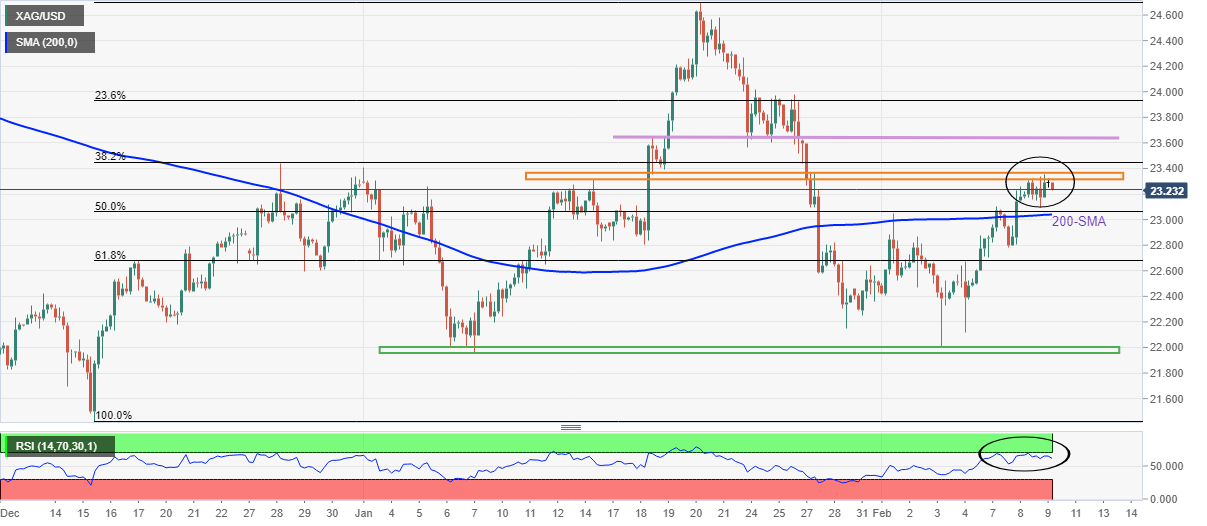
Silver (XAG/USD) consolidates recent gains around $23.20, down 0.26% intraday during Thursday’s Asian session.
In doing so, the bright metal steps back from a two-week high, flashed the previous day, by justifying the strength of a one-month-old horizontal resistance area surrounding $23.25.
Also challenging the XAG/USD bulls are the RSI conditions that don’t back the recent highs.
Even so, silver sellers need to wait for a clear downside break of the 200-SMA level of $23.00 for fresh entries.
Following that, 61.8% Fibonacci retracement (Fibo.) of December-January upside, close to $22.65, may test the XAG/USD bears before directing them to the five-week-old support area near $22.00.
Meanwhile, recovery moves beyond the immediate hurdle around $23.25 isn’t a green card to the silver buyers as a horizontal line from January 18, near $23.65, will challenge the upside moves to the $24.00 threshold.
Should XAG/USD remains firm past $24.00, its run-up towards January’s high of $24.70 can’t be ruled out.
Silver: Four-hour chart
Trend: Pullback expected