US Dollar Index Price Analysis: DXY retreats from three-week-old resistance near 96.00
- DXY snaps two-day uptrend, takes offers to refresh intraday low.
- 100-SMA adds to the upside filters, 50-SMA restricts immediate downside.
- RSI, MACD suggest continuation of sideways grind inside a symmetrical triangle.
US Dollar Index (DXY) remains on the back foot around 95.88, down 0.23% intraday while snapping a two-day uptrend during Monday’s Asian session.
In doing so, the greenback gauge takes a U-turn from a descending resistance line from January 28, as well as 100-SMA.
However, 50-SMA and a five-week-long rising trend line, respectively around 95.85 and 95.50, will challenge the short-term DXY downside.
It should be observed that a symmetrical triangle formation established since mid-January joins almost steady RSI and sluggish MACD signals to hint at the further sidelined performance of the US Dollar Index.
That said, the quote’s weakness past 95.50 will aim for the monthly low of 95.13 and the 95.00 threshold.
On the contrary, the 96.05 level comprising 50-SMA and the aforementioned resistance line challenge the immediate upside of the DXY.
Following that, the monthly high of 96.71 and the 97.00 round figure may test US Dollar Index bulls before directing them to January’s peak of 97.44.
Overall, DXY is likely to remain sidelined inside the symmetrical triangle even if the latest pullback can please intraday bears.
DXY: Four-hour chart
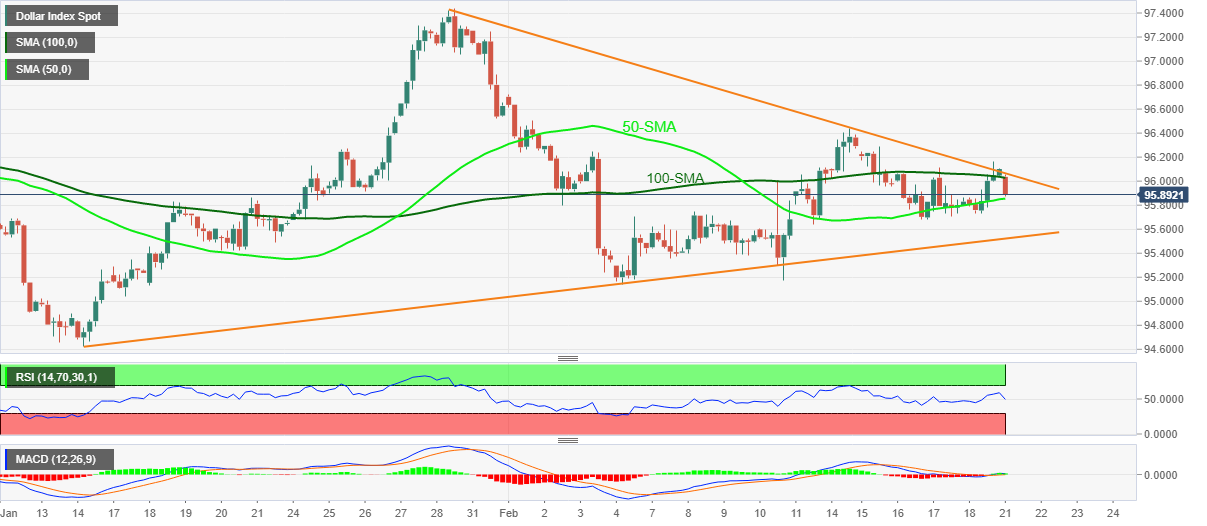
Trend: Further weakness expected